Reprocessed MODIS Version 6.1 Leaf Area Index dataset and its evaluation for land surface and climate modelingIntroduction | Validation and evaluation | Data characteristics | Data download | Data usage | Data citation | Acknowledgements | Contact [3/14/2025 UPDATE]: The reprocessed LAI data has been extended for years 2022-2023. [4/6/2023 UPDATE]: This is the newly reprocessed MODIS Version 6.1 LAI data. The previous version V6 data please visite http://globalchange.bnu.edu.cn/research/laiv6, please note it will not be updated anymore.Introduction The LAI data sets were generated by reprocessing the MODIS version 6.1 LAI products. The raw data used include the MODIS LAI Version 6.1 products MCD15A2H (2002.7.4-2023), MOD15A2H (2000.2.18-2002.6.26) (Myneni et al., 2015) and MODIS Land Cover Type product MCD12Q1 (2001-2023) (Friedl and Sulla-Menashe, 2019). The algorithm is mainly based on the two-step integrated method developed by Yuan et al. (2011). The updates are mainly related to the background value calculations:
We carried out a comprehensive and detailed validation and evaluation for MODIS C6.1 LAI product and reprocessed data, as well as MODIS C5. The results show continuous improvements of both original MODIS LAI Version 6.1 and the reprocessed data as compared with the previous version (see Validation and evaluation). The original MODIS LAI data still show distinct discontinuous and inconsistent values, in terms of time series and spatiotemporal comparison. The reprocessed data perform much better than the original products. We strongly recommend using the reprocessed MODIS C6.1 LAI data sets as a successor for land surface and climate modeling studies. Any feedbacks are welcome. Validation and evaluation For direct validation comparison, a total of 2762 LAI reference maps which contain true LAI values were collected over a subset of 73 sites (Fig. 1) from VALERI, BigFoot (Cohen et al., 2006), Boston University (Yang et al., 2006), SMEX02 (Anderson et al., 2004), GBOV (Bai et al., 2019) and ImagineS (Fuster et al., 2020). The scatter plot is shown in Fig. 2. 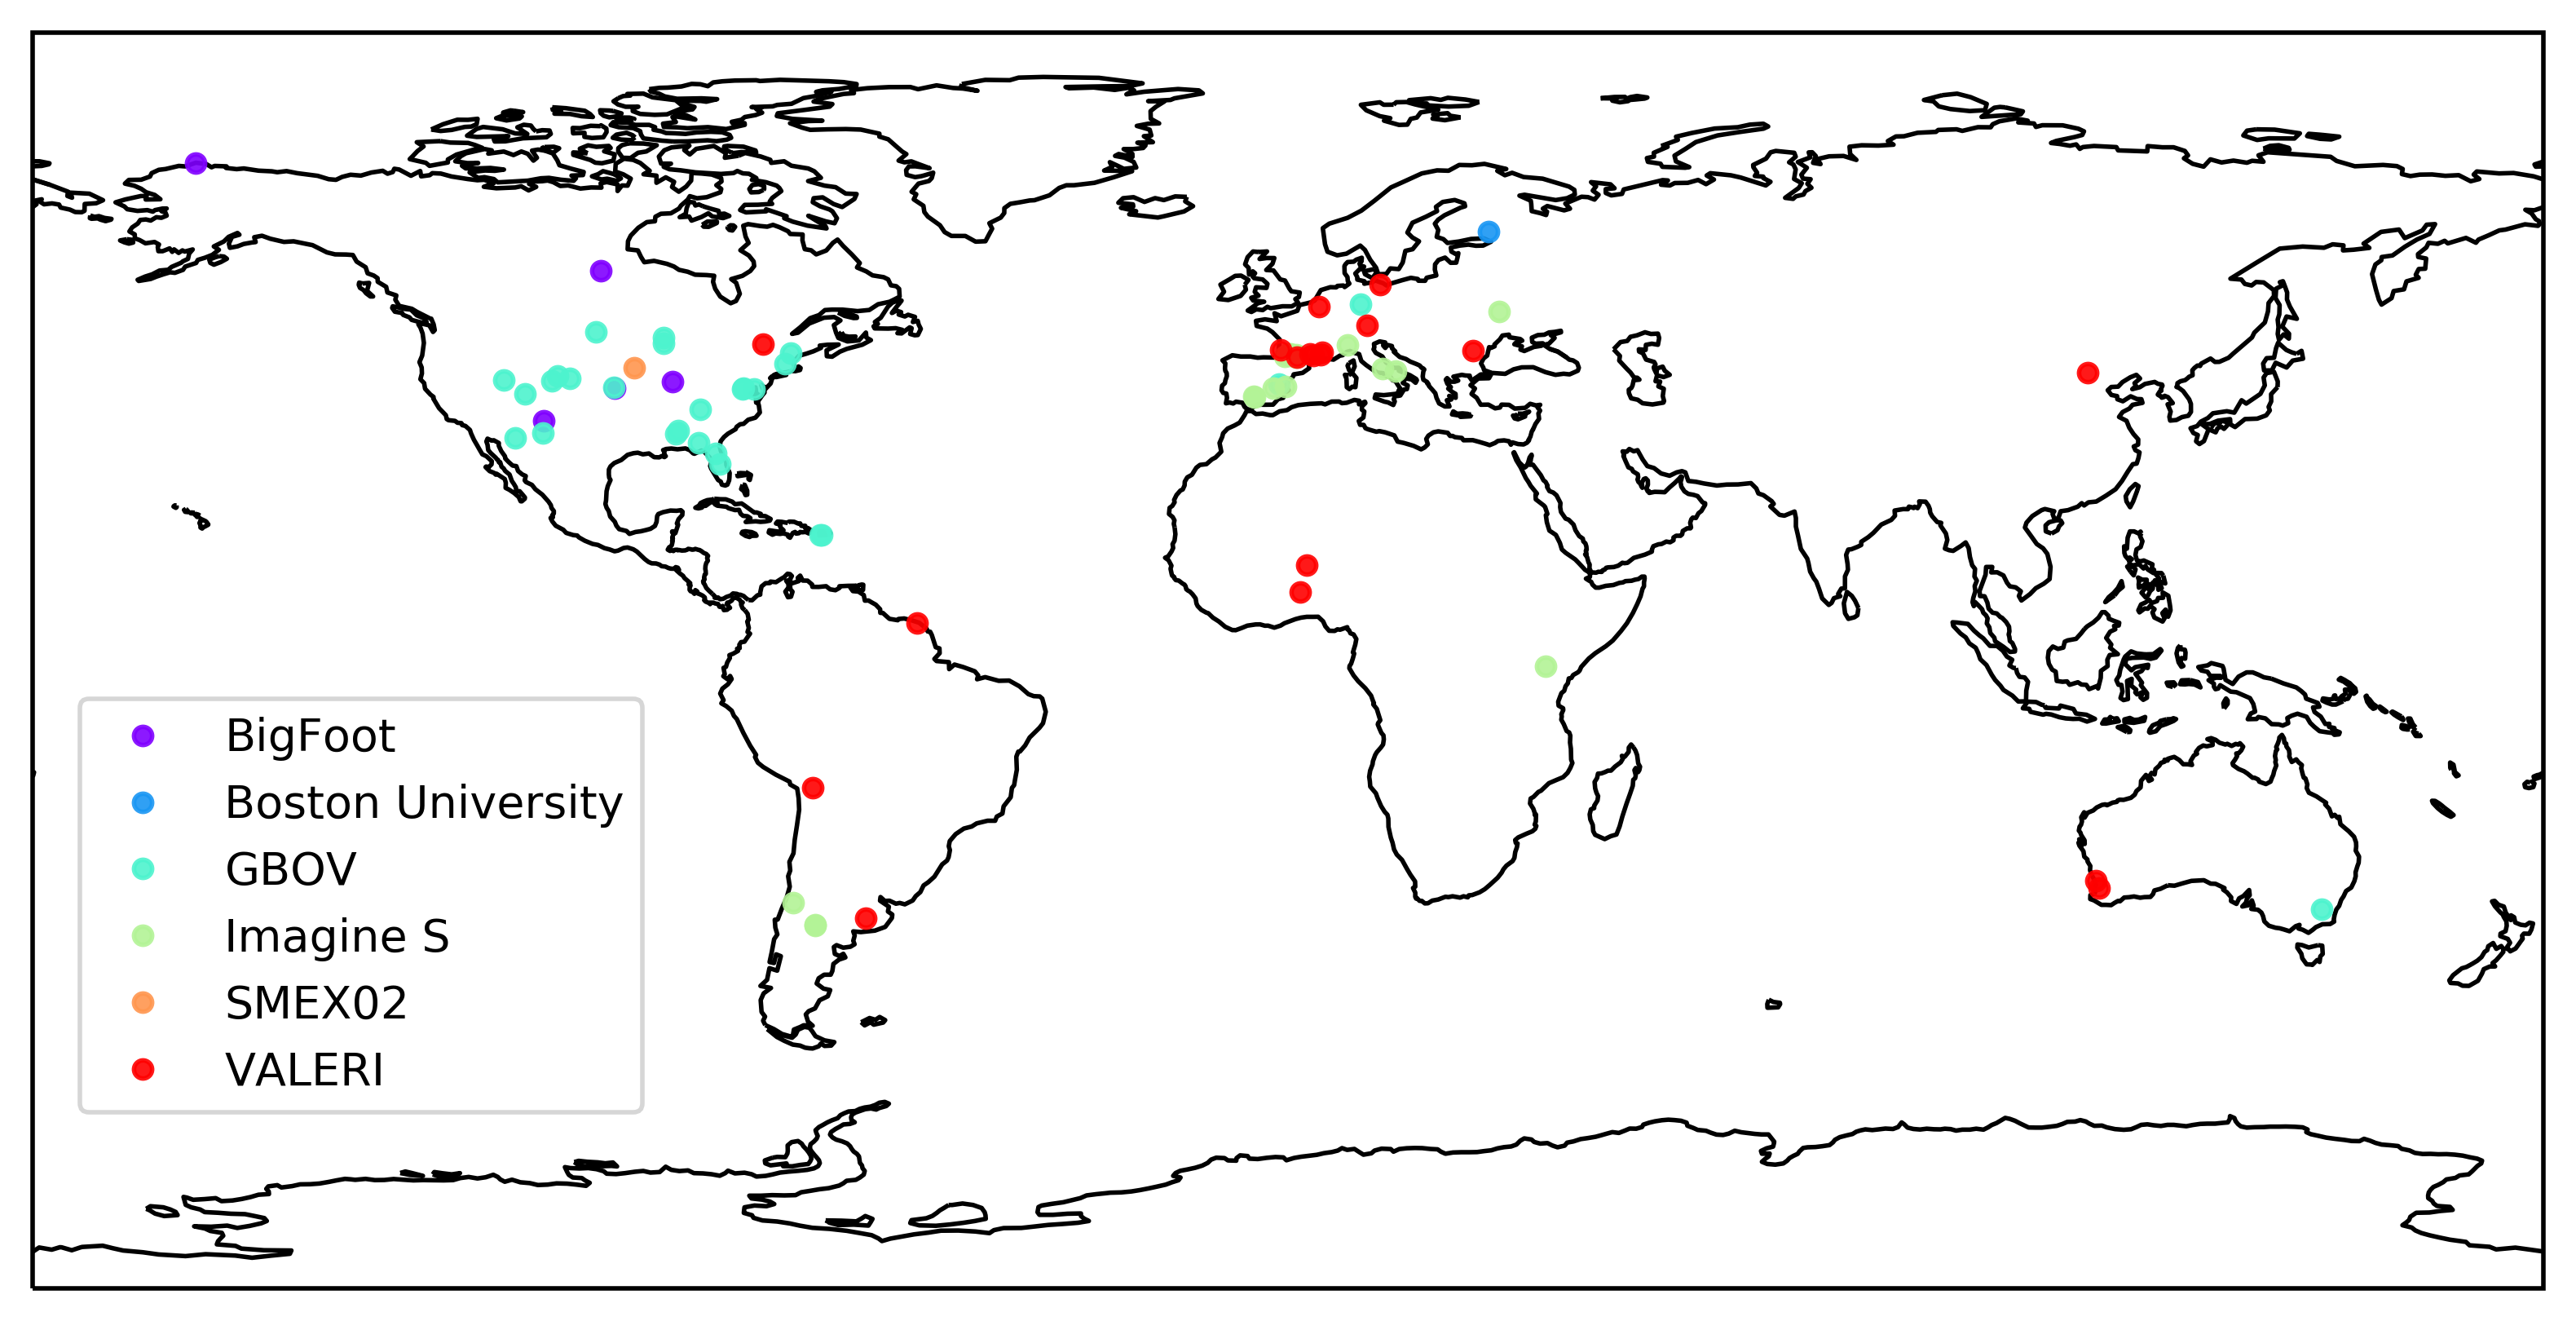 Fig. 1. The location of validation sites.
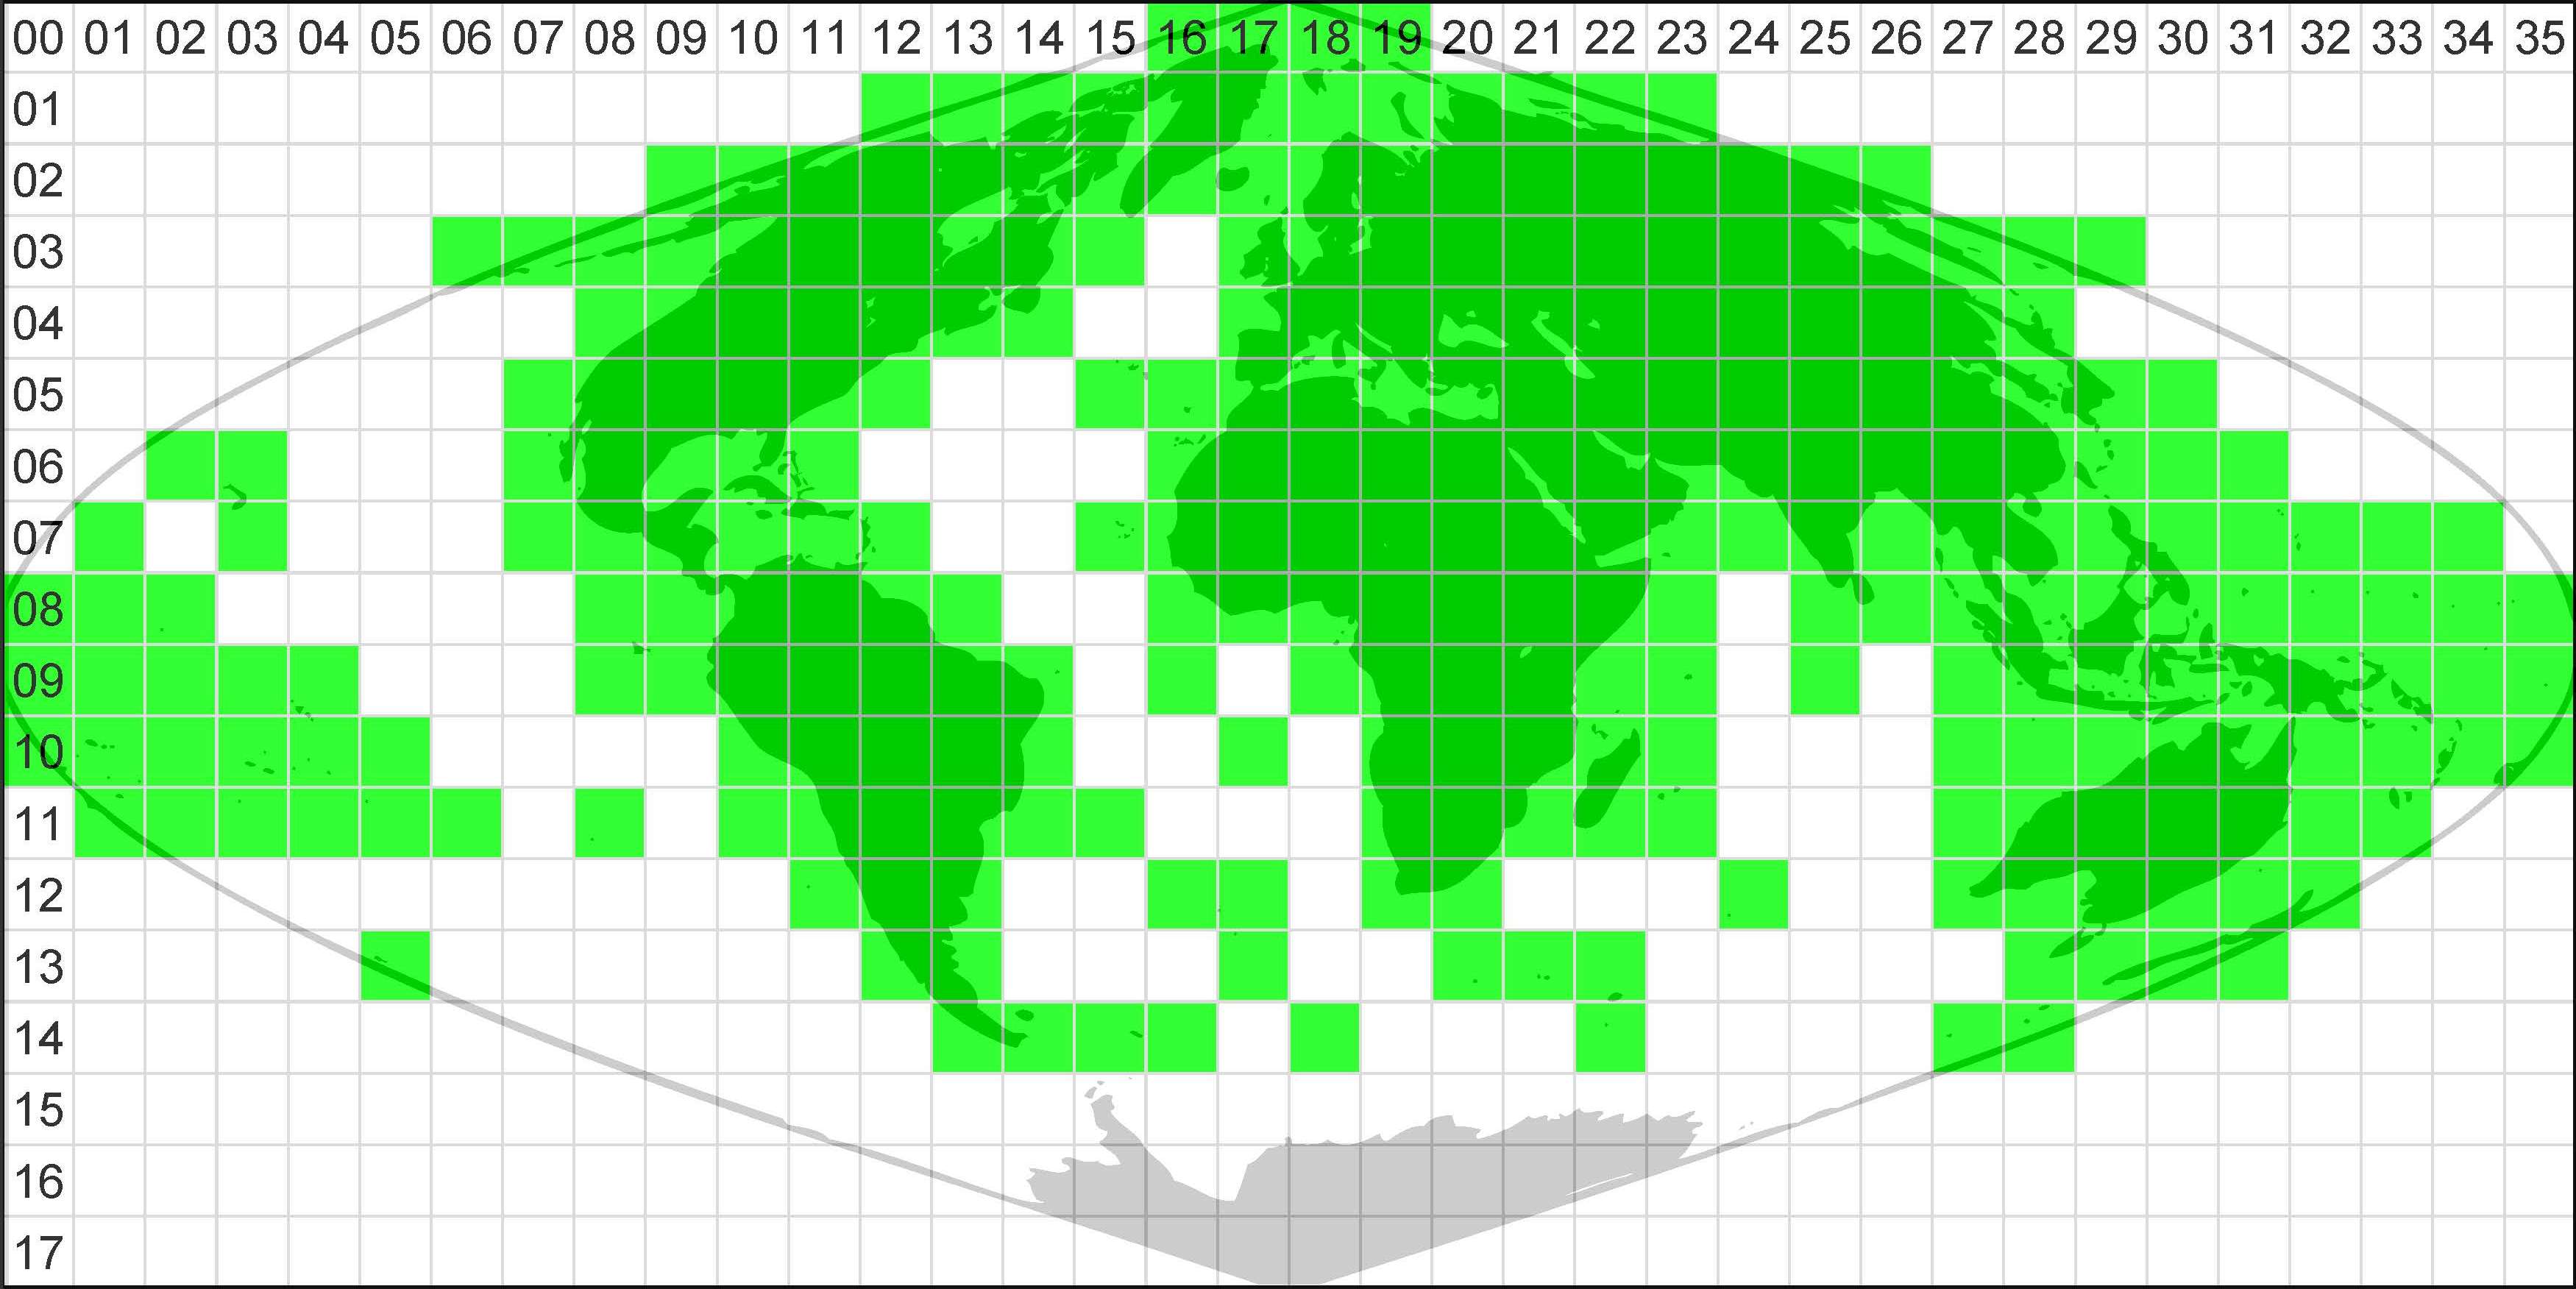
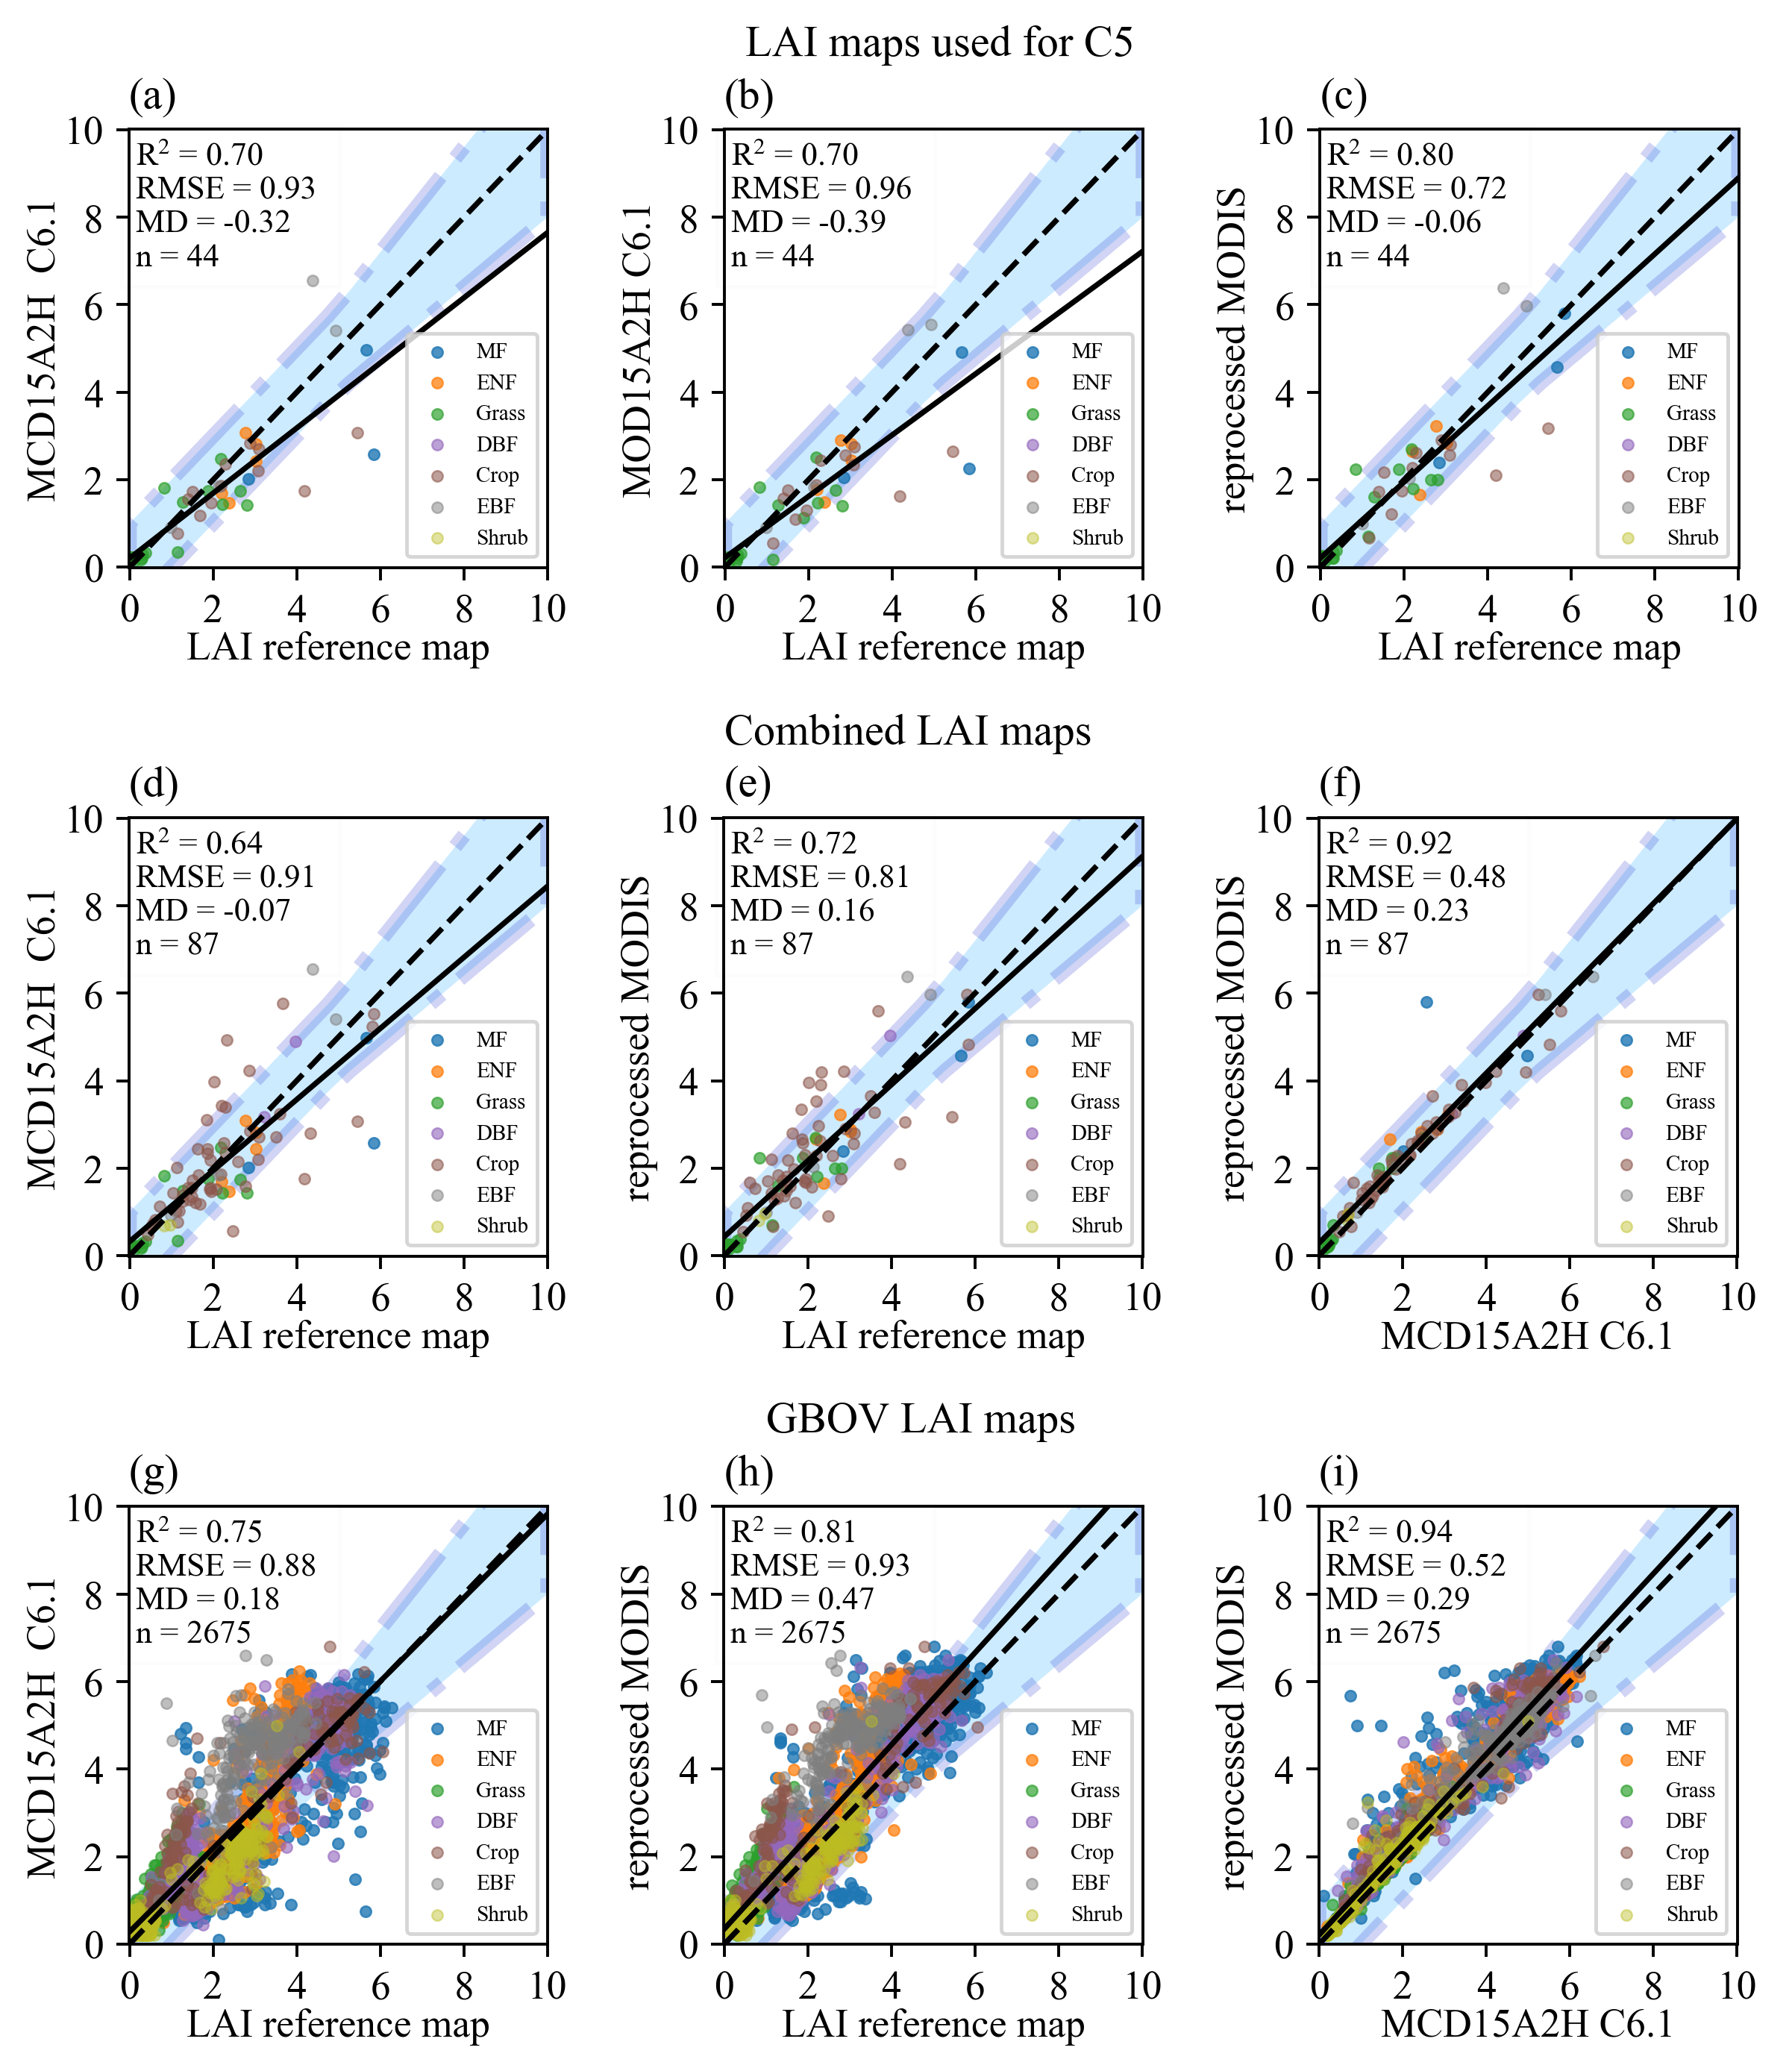 Fig. 2. Scatter plot of direct validation of MODIS C6.1 LAI products and reprocessed LAI data using (a) reference maps used for MOD C5 LAI validation (Yuan et al., 2011), (b) all collected maps excluding GBOV maps (Combined LAI maps) and (c) GBOV LAI maps. “MD” represents the mean difference between the LAI values displayed on the y axis and x axis. The solid line in each plot is the linear fitted line. The shaded area represents the uncertainty agreement ratio (Brown et al., 2020; Garrigues et al., 2008), which is the larger of 20% of LAI reference map value and 1 m2/m2 . For the temporal comparison, we selected three sites from each land cover type. The time-series plot is shown in Fig. 3. The available LAI reference map values were marked in the plot. At the same time, the QC information, which represents the dominant retrieval algorithm, is drawn in a histogram style using different colors.  Fig. 3. Time series plot of MCD15A2H C6.1 and reprocessed MODIS LAI mean values within the extent of reference maps. For the period before 2002.6.26, LAI data from MOD15A2H C6.1 product was used in case the LAI reference maps data existed. For spatiotemporal comparison, a representative tile (h19v08) is selected as shown below (Fig. 4). Two simple indexes were defined to quantitatively represent the level of spatial and temporal discontinuity respectively. The spatial discontinuity index (SDI) was derived based on the assumption that each pixel was adjacent to the other 8 surrounding pixels. In each 10×10 km2 region, we calculated the average value of the absolute LAI difference of all pairs of adjacent pixels. The temporal discontinuity index (TDI), on the other hand, was described as the average value of the absolute LAI difference between all the adjacent time steps in a given period. The time step was set to 8 days. TDI was first calculated at every 500×500 m2 pixel and then aggregated to 10×10 km2.
 Fig. 4. Spatiotemporal comparison of tile h19v08 (1200×1200 km2). The central point's longitude and latitude of the spatial domain are 15.055E and 5.002N. The first 5 frames of the first column represent MODIS LAI values of the five 8-day composites which are labeled to the left of the figure. The first 5 frames of the second column represent reprocessed MODIS LAI value. The “QC” column refers to the MODIS LAI quality control information. The last 2 columns represent the spatial discontinuity index (SDI) of MODIS and reprocessed MODIS respectively. The last row is the temporal discontinuity index (TDI) derived from the five 8-day composites of MODIS and reprocessed MODIS respectively. For global-scale spatiotemporal comparison, different versions of MODIS products and reprocessed MODIS were compared as shown below (Fig. 5, 6). 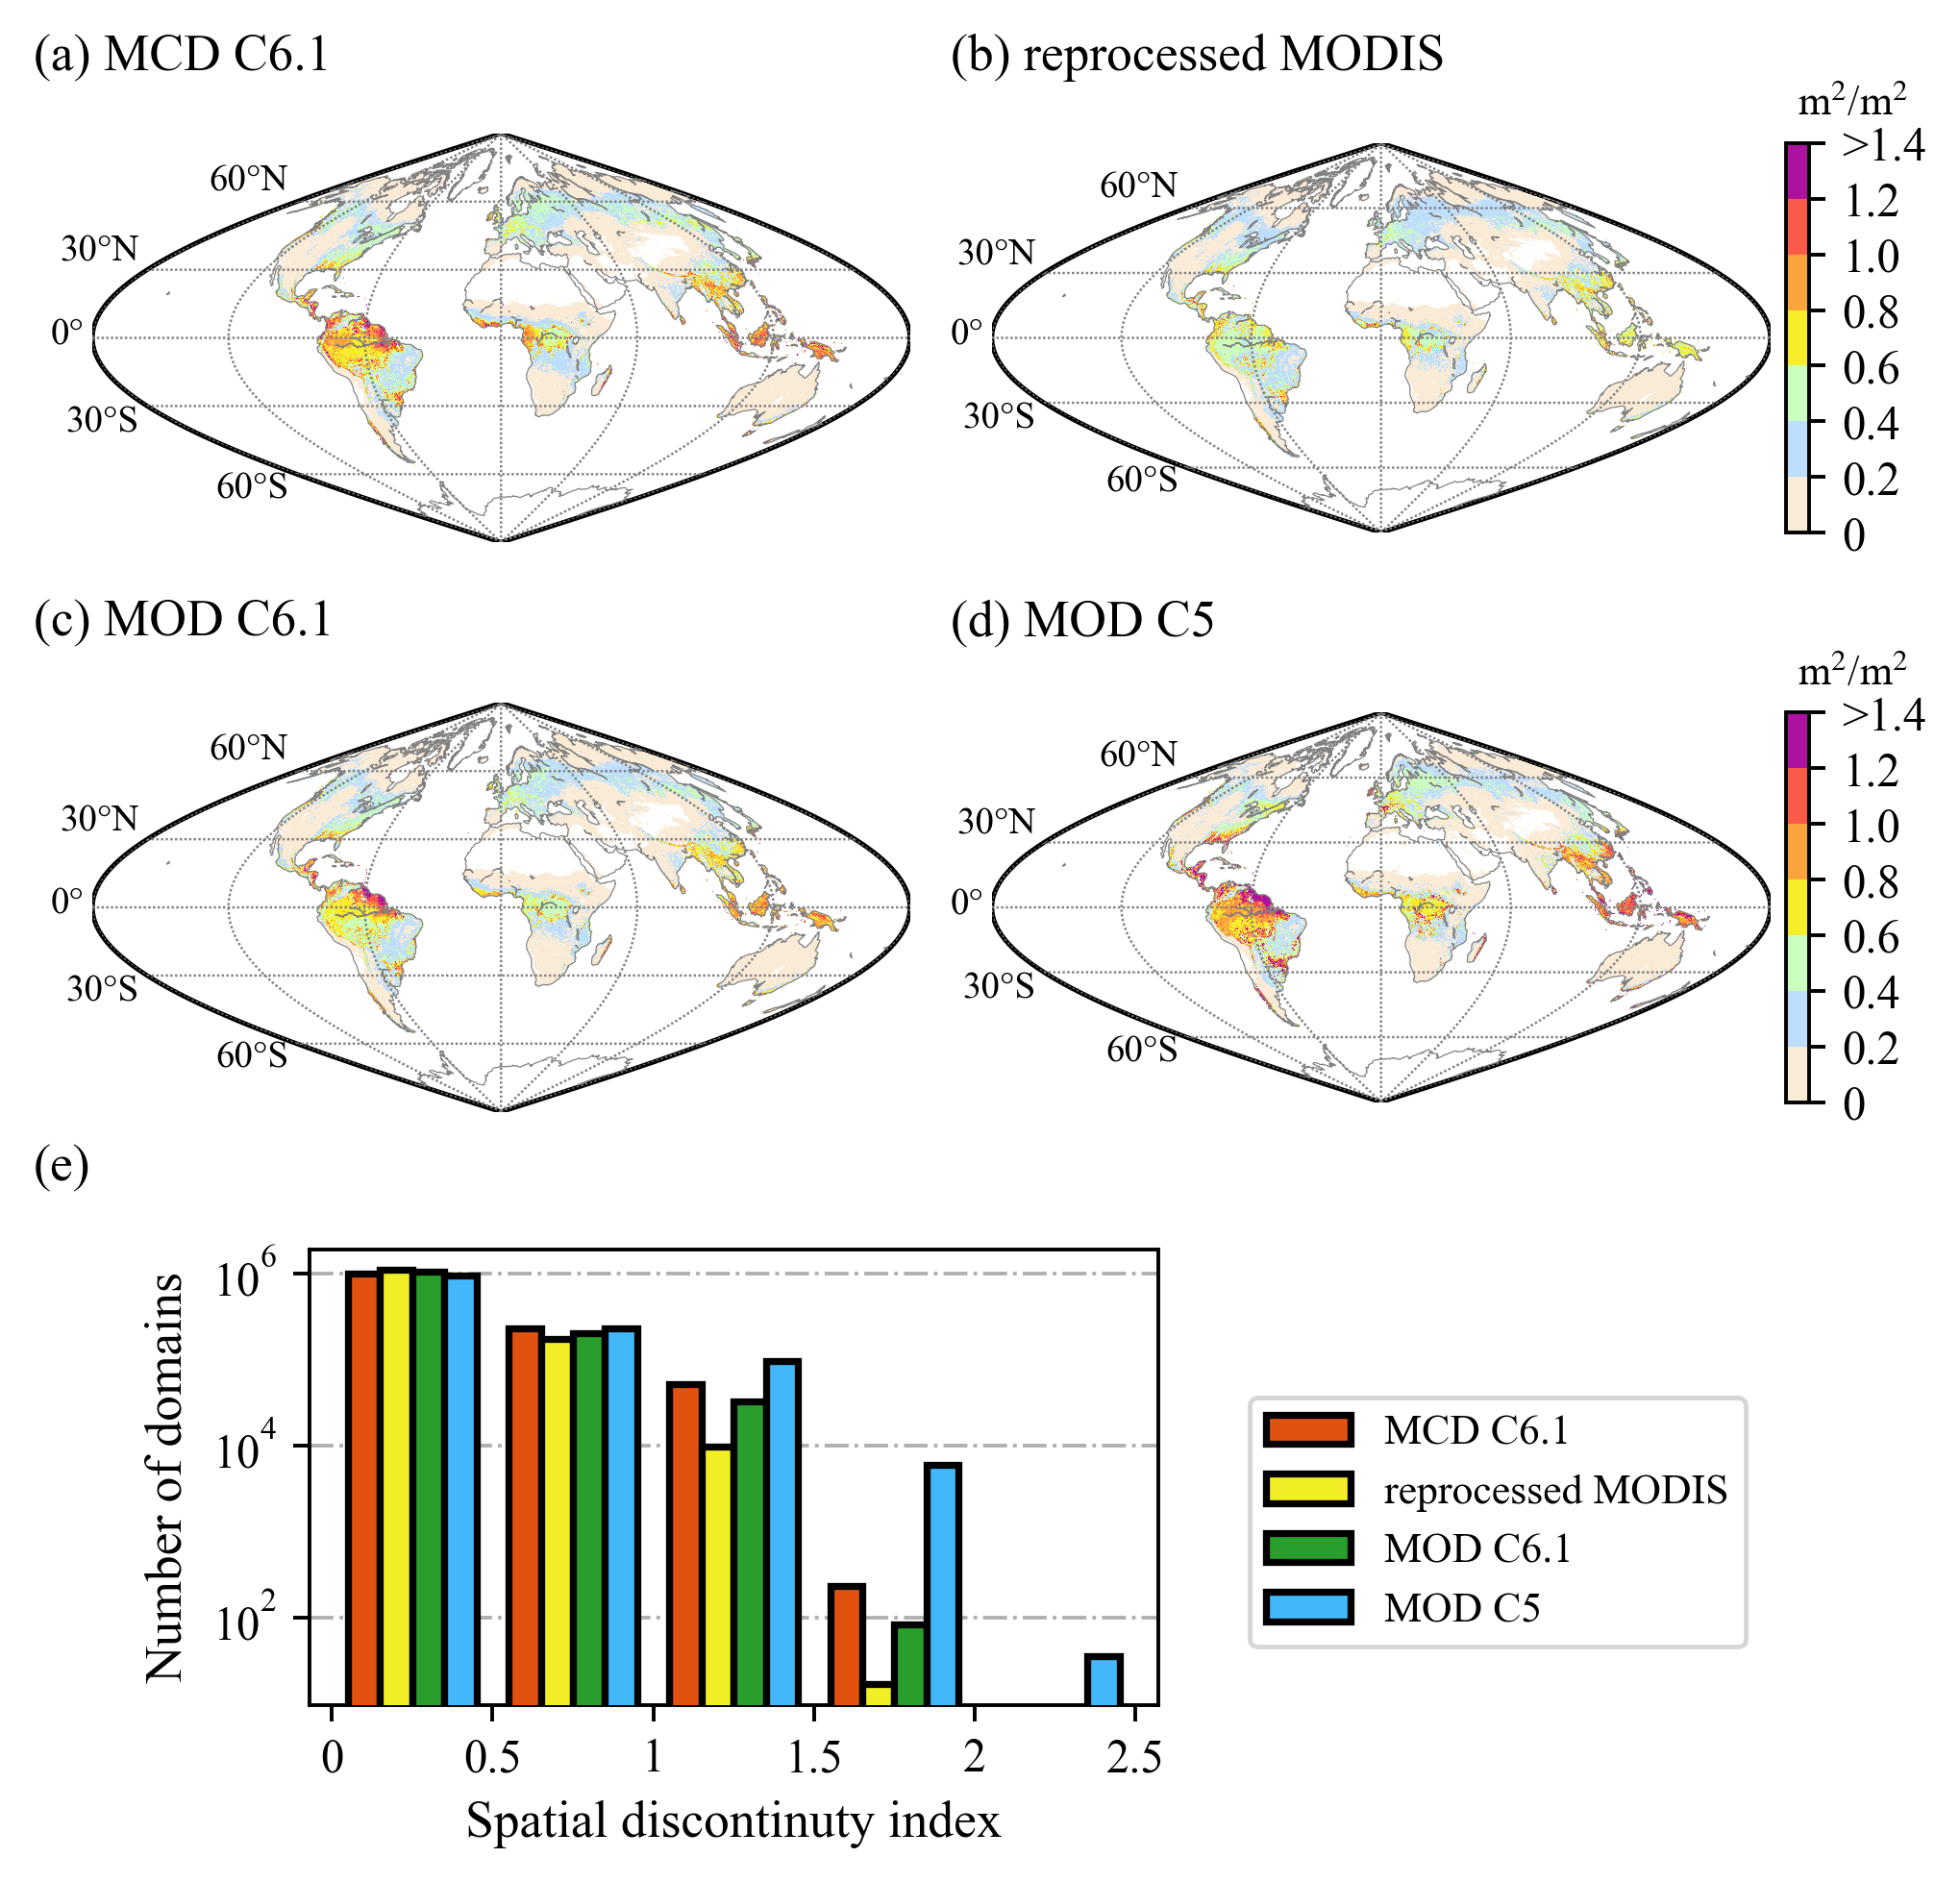 Fig. 5. 14-year mean (2003-2016) spatial discontinuity index (SDI) maps of MCD15A2H C6.1, reprocessed MODIS, MOD15A2H C6.1 and MOD15A2H C5 LAI data (a-d), and the number of domains of these maps over different ranges of SDI values (e).  Fig. 6. Temporal discontinuity index (TDI) maps for the 14-year period (2013-2016) of MCD15A2H C6.1, reprocessed MODIS, MOD15A2H C6.1 and MOD15A2H C5 LAI data (a-d), and the number of domains of these maps over different ranges of TDI values (e). Data characteristics
Data download Caution: The reprocessed data for downloading consists two MODIS version 6.1 products, i.e., MCD15A2H (2002.7.4-2023) and MOD15A2H (2000.2.18-2002.6.26). The prefix “MCD” stands for a combined product, whose algorithm chooses the best pixel available from all the acquisitions of both MODIS sensors located on NASA’s Terra and Aqua satellites, while “MOD” data are retrieved only from the Terra satellite. We have found that their temporal-mean values were different especially in the equatorial region, which may result in an unrealistic trend (see Lin et al., 2023 for detailed discussion). Therefore, attention should be paid when using the reprocessed products for long-term trend analysis and data starting from year 2003 (i.e., only MCD) was recommended for LAI trend study. 1. 500 meters, 8-day, HDF-EOS format
2. 15 seconds, 8-day, NetCDF-4 format
3. 0.05 degree, NetCDF-4 format
4. 0.1 degree, NetCDF-4 format
5. 0.25 degree, NetCDF-4 format
6. 0.5 degree, NetCDF-4 format
Data usage For HDF-EOS format (the same with MODIS LAI products), you can access it via HDF-EOS libraries or tools. Many examples can be found on HDF-EOS Tools and Information Center. The netCDF format data sets in Geographic Coordinates are re-projected from HDF-EOS Sinusoidal projection data sets using the nearest sampling method. There are many freely available softwares for manipulating or displaying NetCDF Data. Data citation
Acknowledgements The MODIS LAI and land cover type products were made available from https://lpdaac.usgs.gov, maintained by the NASA EOSDIS Land Processes Distributed Active Archive Center (LP DAAC). We want to thank Per Jönsson and Lars Eklundh for providing software TIMESAT on the web site. We also want to thank the VALERI project, BigFoot science team and CEOS LPV group for providing LAI reference maps on their web sites. This study has been undertaken using LAI high resolution reference maps from GBOV “Ground Based Observation for Validation” (https://land.copernicus.eu/global/gbov) founded by European Commission Joint Research Centre FWC932059, part of the Global Component of the European Union’s Copernicus Land Monitoring Service. GBOV products are developed and managed by ACRI-ST with the support from University College London, University of Leicester, University of Southampton, University of Valencia and Informus GmbH. We thank Courtney Meier, Alexander Knohl Lukas Siebicke, J. William Munger, TBD, Katherine N. Suding, Will Woodgate and Ernesto Lopez-Baeza and the NEON, FLUXNET, TREN and UVEG networks for the measurements collected in the field and used to generate GBOV products. We want to thank Aryeh Feinberg for feedback on the earlier version of the reprocessed LAI data. We also want to thank Luke Brown for suggestion on using the GBOV reference maps. Contact If you have any questions when using LAI data sets, please email yuanh25@mail.sysu.edu.cn. |
 |