LAI data sets for land surface and climate modellingIntroduction | Data characteristics | Data download | Data usage | Data citation | Help [1/16/2017 UPDATE]: the reprocessed LAI data has been extended for year 2016. The input MODIS data and algorithm used are as before. The new generated LAI data (2016) used the background value of 10 years (2007-2016) MODIS products. Data in HDF-EOS and NetCDF formats are provided. The original MODIS LAI data are from LP DAAC. [3/11/2016 UPDATE]: the reprocessed LAI data has been extended for year 2015. The input MODIS data and algorithm used are as before. The new generated LAI data (2015) used the background value of 10 years (2006-2015) MODIS products. Data in HDF-EOS and NetCDF formats are provided. The original MODIS LAI data are from LP DAAC. [3/27/2015 UPDATE]: the reprocessed LAI data has been extended for year 2014. The input MODIS data and algorithm used are as before. The new generated LAI data (2014) used the background value of 10 years (2005-2014) MODIS products. Data in HDF-EOS and NetCDF formats are provided. The original MODIS LAI data are from LP DAAC. [4/10/2014 UPDATE]: the reprocessed LAI data has been extended to year 2013. The input MODIS data and algorithm used are as before. The new generated LAI data (2010-2013) used the background value of 10 years (2004-2013) MODIS products. Data in HDF-EOS and NetCDF formats are provided. The original MODIS LAI data are from LP DAAC. IntroductionThe LAI data sets were generated by reprocessing the MODIS LAI products. A two-step integrated method was developed to generate the improved MODIS LAI products. First, we used the modified temporal spatial filter (mTSF) based on TSF method develop by Fang et al. (2007; 2008) to fill the gaps of the MODIS LAI data and process the lower quality data according to the quality control (QC) and filled value information by making the best use of the high quality data. Then the TIMESAT Savitzky-Golay (SG) filter (Jönsson and Eklundh, 2004)--as post processing--was applied to generate the final improved MODIS LAI products. For direct validation comparison, a total of 44 LAI reference maps which contain true LAI values were collected over a subset of 26 sites (Fig. 1) from VALERI, BigFoot (Cohen et al., 2006), Boston University (Yang et al., 2006) and SMEX02 (Anderson et al., 2004). The scatter plot is shown in Fig. 2. 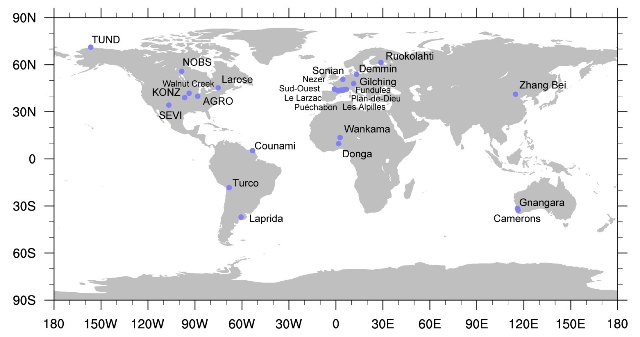 Fig. 1: The location of validation sites.
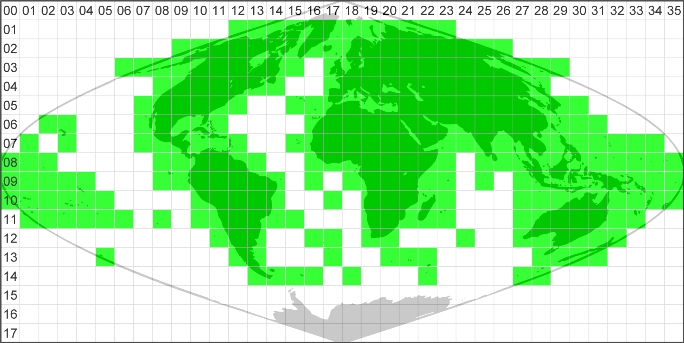
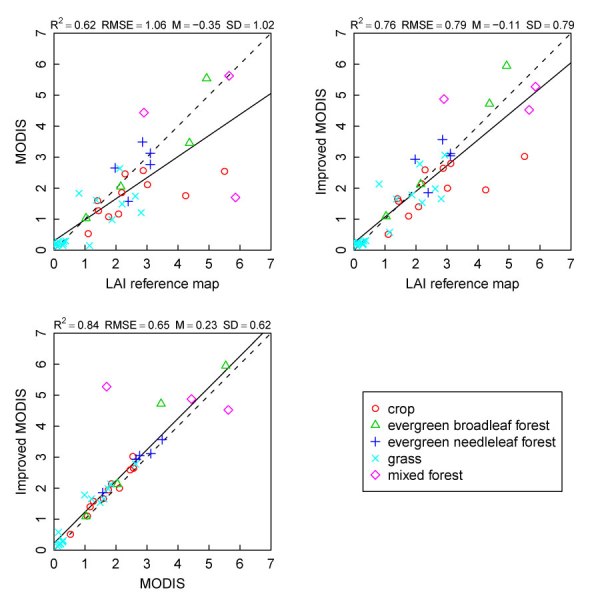 Fig. 2: Scatter plot of direct validation. "M" and "SD" represent the mean and the standard deviation of the difference between the LAI values displayed in the y axis and x axis. The solid line in each plot is the linear fitted line. For the temporal comparison, we selected three sites from each land cover type. The time-series plot is shown in Fig. 3. The available LAI reference map values were marked in the plot. At the same time, the QC information, which represents the dominant retrieval algorithm, is drawn in a histogram style using different colors. 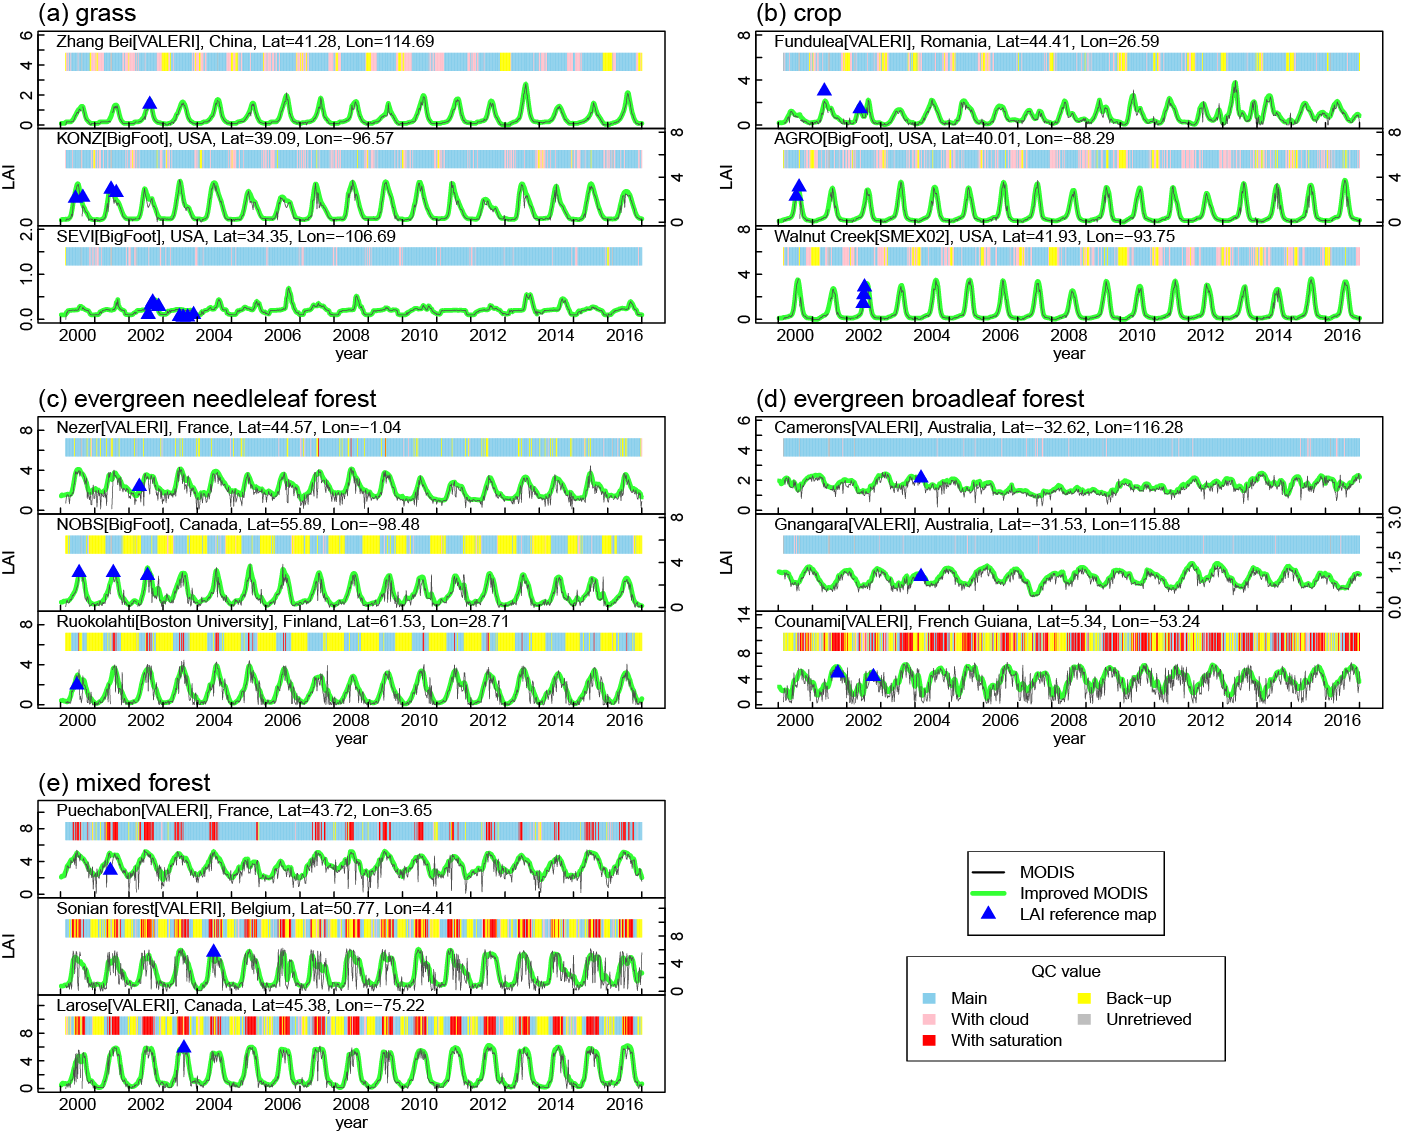 Fig. 3: Time-series plot of LAI values. The QC values, which indicate the retrieved algorithm, are drawn a histogram style in different colors. For spatiotemporal comparison, a representative tile (h12v09) is selected as shown below (Fig. 4). 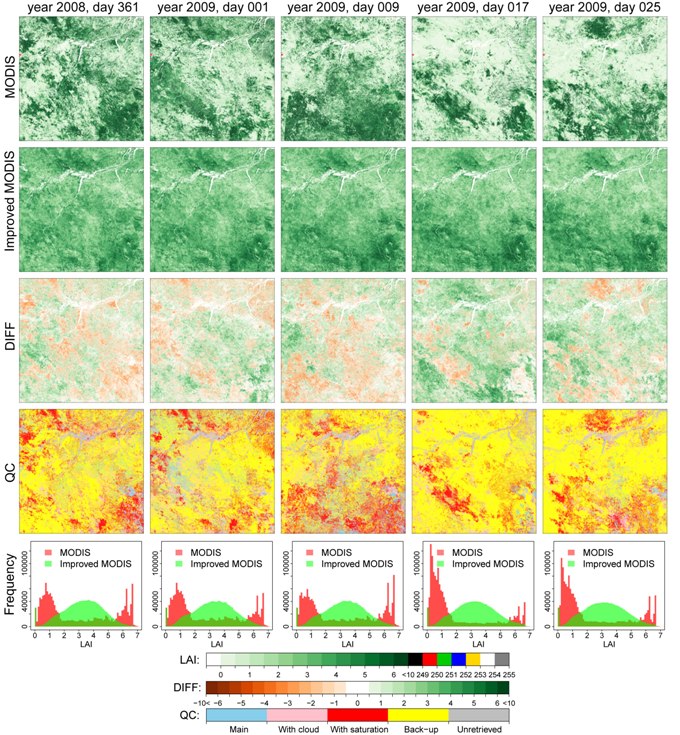 Fig. 4: Spatiotemporal comparison of tile h12v09 (1200km x1200km). The spatial domain boundary points' longitudes and latitudes are: upper left (60.01W, 00.00N), upper right (49.80W, 00.00S), lower left (60.93W, 10.00S), lower right (50.57W, 10.00S). The frames of the first row represent MODIS LAI values of the five 8-day composites which are labeled at the top of figure. The second row is improved MODIS LAI value. The "DIFF" row represents the differences (Improved MODIS-MODIS). The "QC" row refers to the MODIS LAI quality control information. The last row is the statistic of frequency of LAI values within this tile. Data characteristics
Data download 1. HDF-EOS format
2. NetCDF-3 format
3. NetCDF-4 format
For HDF-EOS format (the same with MODIS LAI products), you can access it via HDF-EOS libraries or tools. Many examples can be found on HDF-EOS Tools and Information Center. The netCDF format data sets in Geographic Coordinates are re-projected from HDF-EOS Sinusoidal projection data sets using the nearest sampling method. There are many freely available softwares for manipulating or displaying NetCDF Data. Data citation
Yuan, H., Dai, Y., Xiao, Z., Ji, D., Shangguan, W., 2011. Reprocessing the MODIS Leaf Area Index Products for Land Surface and Climate Modelling. Remote Sensing of Environment, 115(5), 1171-1187. doi:10.1016/j.rse.2011.01.001
If you have any questions when using LAI data sets, please email yuanh25@mail.sysu.edu.cn. |
 |